Footfall
Analytics platform, designed and built
An analytics product that makes a firehose of data feel like a calm dashboard — one that answers the question before you finish asking it.
- Year2026
- Runs onWeb app
- DisciplineSaaS Applications
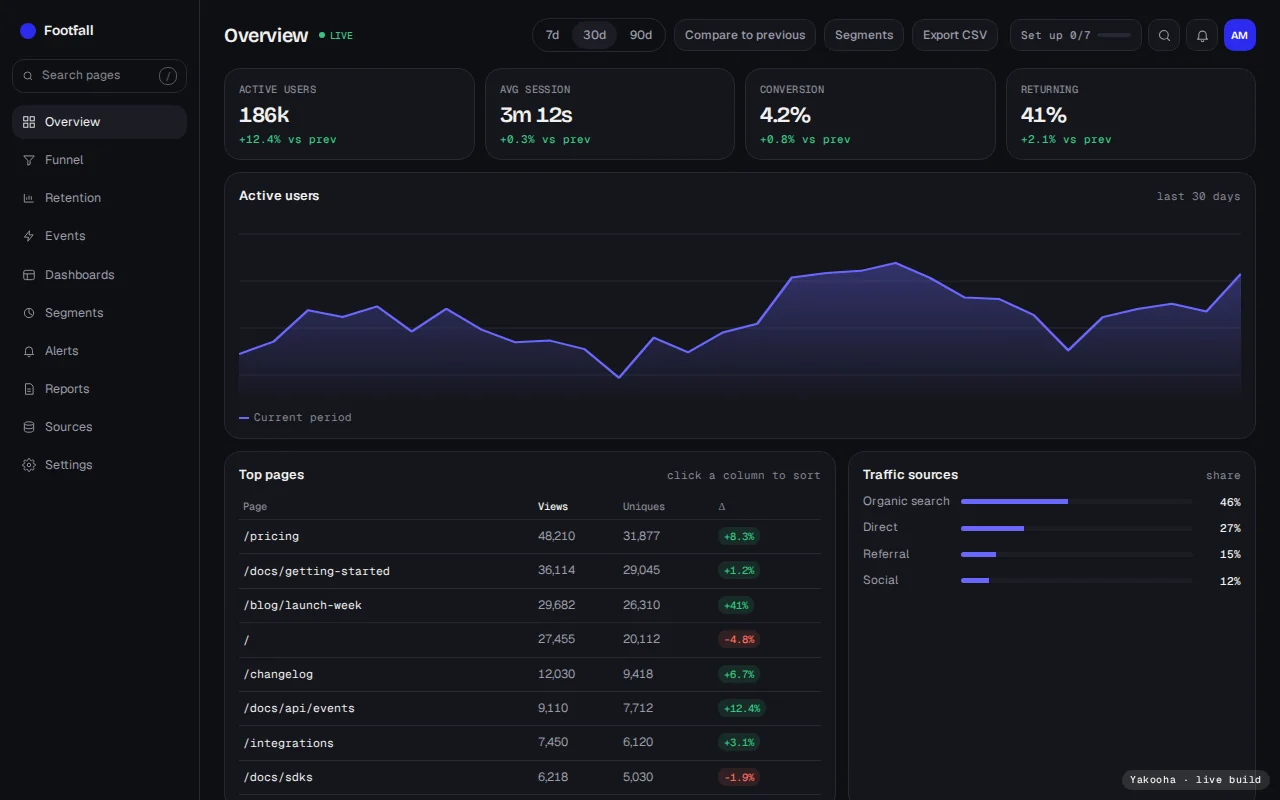
A sample brief, a real product. We wrote this brief ourselves to show how we work; the client and their story are illustrative. The product is not: it was designed and engineered here, and you can use it below. We publish results only for work a client has let us verify, so this page shows none.
The brief
Footfall needed an analytics platform that its own team could be proud of — fast, honest with numbers, and light enough that non-analysts would actually open it.
We took it from empty repo to live product: the data model, the interface, the charts, the query layer and the polish.
The problem
Analytics tools drown people in options. The hard part was not drawing charts — it was deciding what not to show, and making the few things that mattered instant.
- Sub-second queries over large datasets
- A chart system that stays legible when data is ugly
- Dashboards a beginner can build in minutes
- A visual language that reads as trustworthy
The approach
We designed the information architecture first, then built vertically — one real dashboard, wired to real data, before we scaled the pattern across the product.
- Typed query layer with aggressive caching
- A restrained chart kit built on a single grid
- Server-driven layouts, no bespoke pages
- Motion used only to explain change, never to decorate
What shipped
- Funnel, retention cohorts and event stream views
- Segments, saved and ad hoc
- Compare to previous period
- Sortable pages with search
- CSV export and a live toggle
- Custom dashboards
- Alerts and scheduled reports
- Sources with SDK snippets
Under the surface
How it is built
Event ingestion lands in Kafka, compacts into ClickHouse for sub-second aggregate queries, and a Next.js app on Vercel streams server-rendered dashboards; heavy rollups run as scheduled materialised views.
- Kafka topics per event class, replayable backfills
- Row-level security tokens minted per workspace
- Edge-cached public share links with signed URLs
Considered and turned down
TimescaleDB + Redis was the simpler path — ClickHouse won on cardinality and cost per billion rows.
Stack
The mechanism, working
The part of Footfall that was hardest to get right, as a small model you can operate.
Pre-aggregated analytics
Raw events land in Kafka and compact into ClickHouse materialised views, so a dashboard reads a few pre-aggregated rows instead of scanning every event.
