Morning Report
Dashboard for an ops team
An operations dashboard that replaces a wall of spreadsheets with one screen an ops lead can trust at 6am.
- Year2026
- Runs onWeb app
- DisciplineUI/UX & Product Design
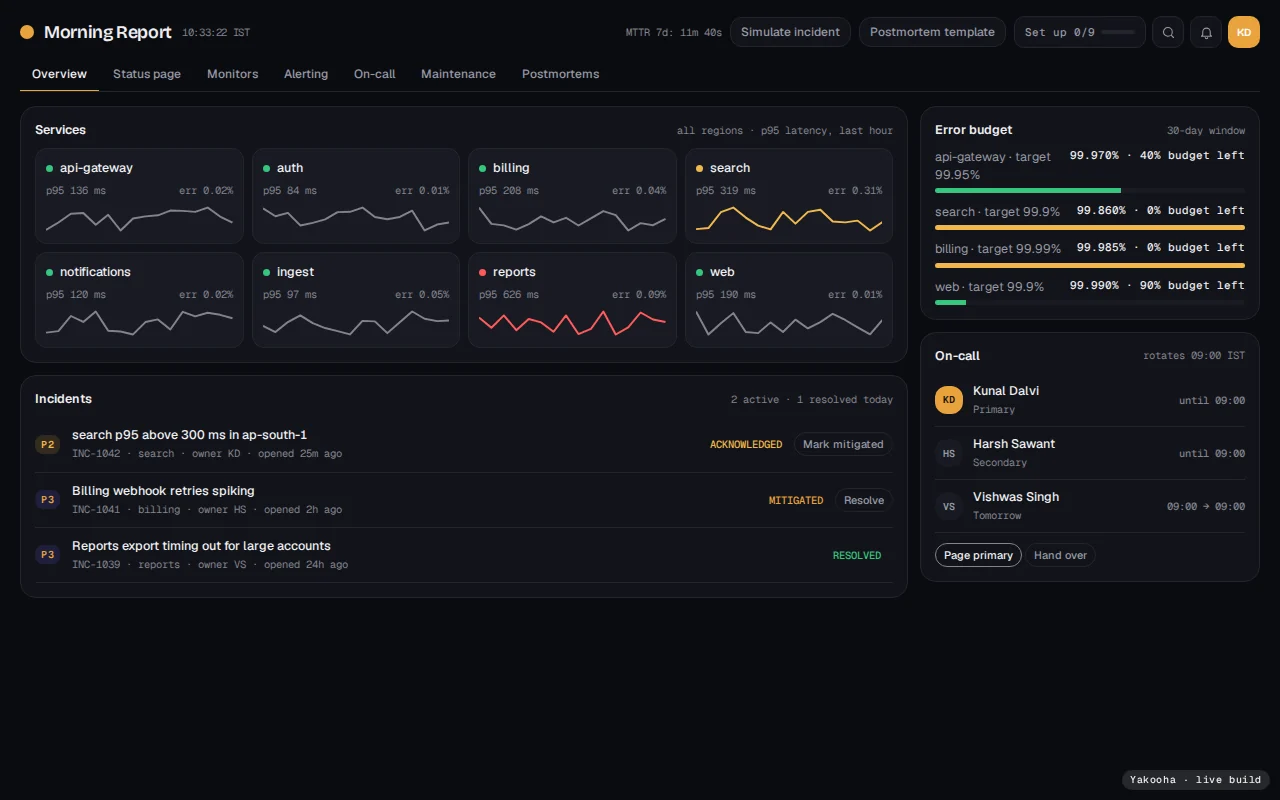
A sample brief, a real product. We wrote this brief ourselves to show how we work; the client and their story are illustrative. The product is not: it was designed and engineered here, and you can use it below. We publish results only for work a client has let us verify, so this page shows none.
The brief
Morning Report’s ops team ran the business out of a dozen spreadsheets. We designed a single source of truth they could act on, not just admire.
The problem
Ops dashboards are where good intentions go to die — too dense, too slow to change. This one had to stay useful as the business shifted under it.
- Dense information that stays scannable
- Alerts that mean something
- A layout that adapts to new metrics
- Trust — numbers that always reconcile
The approach
We shadowed the team for a week, learned which numbers actually drove decisions, and designed around those.
- A priority-led information hierarchy
- Thresholds and alerts co-designed with ops
- A flexible grid for metrics yet to exist
- A component kit their engineers could ship
What shipped
- Service sparklines
- Incident drawer with a legal state machine, timeline, notes and reassignment
- Error budgets
- On-call handover and rotation with overrides
- Simulate an incident
- Postmortem download
- Public status page
- Monitors, alert rules and escalation policies
- Maintenance windows
Under the surface
How it is built
A Go collector streams service heartbeats over WebSockets into TimescaleDB; the React/TypeScript console renders incident state machines, and Grafana handles the long-tail dashboards ops already trusts.
- Go collector: 40k heartbeats/s on one small node
- Incident lifecycle as an explicit state machine
- WebSocket fan-out with backpressure handling
- Timescale continuous aggregates for uptime bars
Considered and turned down
Node for the collector — Go’s goroutines and memory profile won the ingestion path.
Stack
The mechanism, working
The part of Morning Report that was hardest to get right, as a small model you can operate.
Incident state machine
Open → acknowledged → mitigated → resolved, with every transition audited and every timer explicit.
